Haendelser
Fanen Begivenheder viser en grafisk tidslinje over 56 dage med alle førerens aktiviteter.
Farvekoder for aktiviteter
Diagrammet viser de forskellige aktiviteter ved hjælp af farvekoder:
- Kørsel - køretøjet var i bevægelse
- Arbejde - anden arbejdsaktivitet (f.eks. læsning)
- Tilgængelighed - venten, standby
- Hvile - hvileperiode
Interaktive funktioner
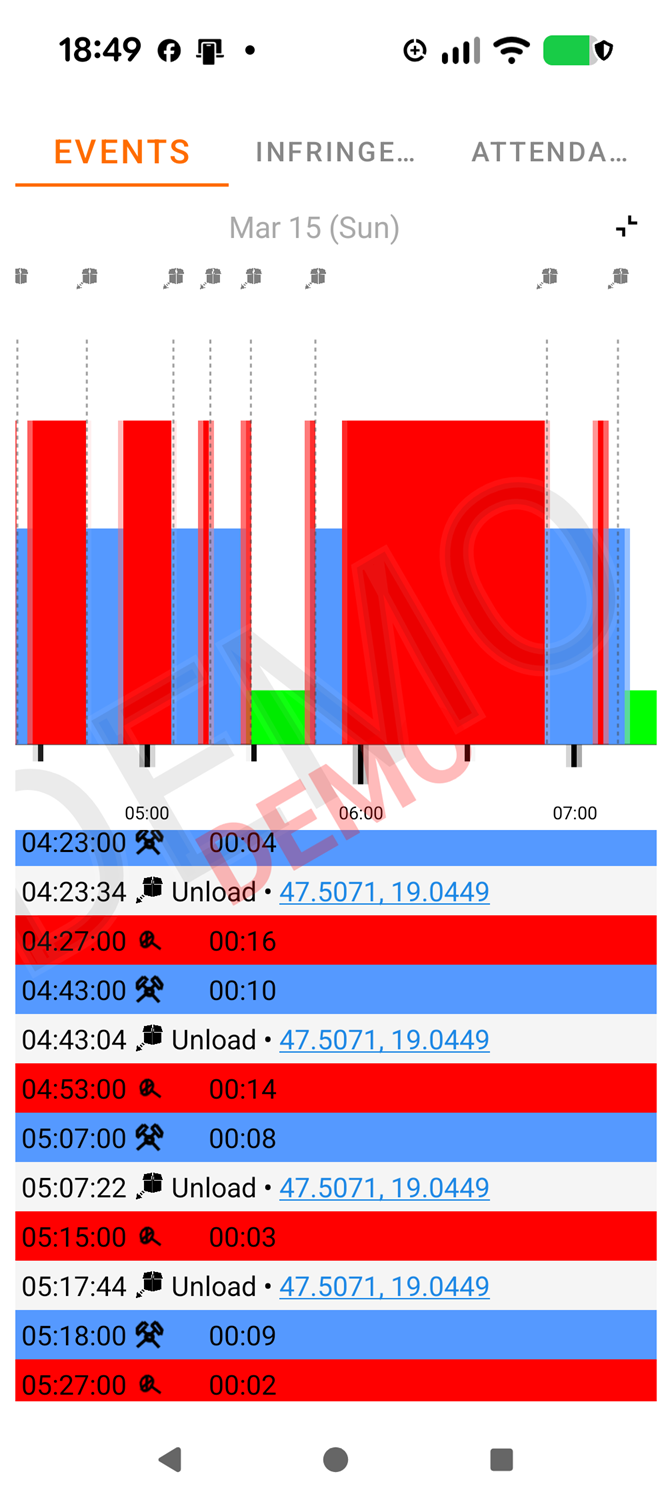
Diagrammet kan zoomes: du kan knibe for at zoome ind i detaljerne, så du kan gennemgå den daglige aktivitet ned til minuttet. Ved at trykke på en dag vises den detaljerede begivenhedsliste for den pågældende dag med tidsstempler. Ved at trykke på et element i begivenhedslisten nederst zoomer diagrammet automatisk ind på den valgte begivenhed. Ved at trykke på GNSS-koordinater vises positionen på kortet.
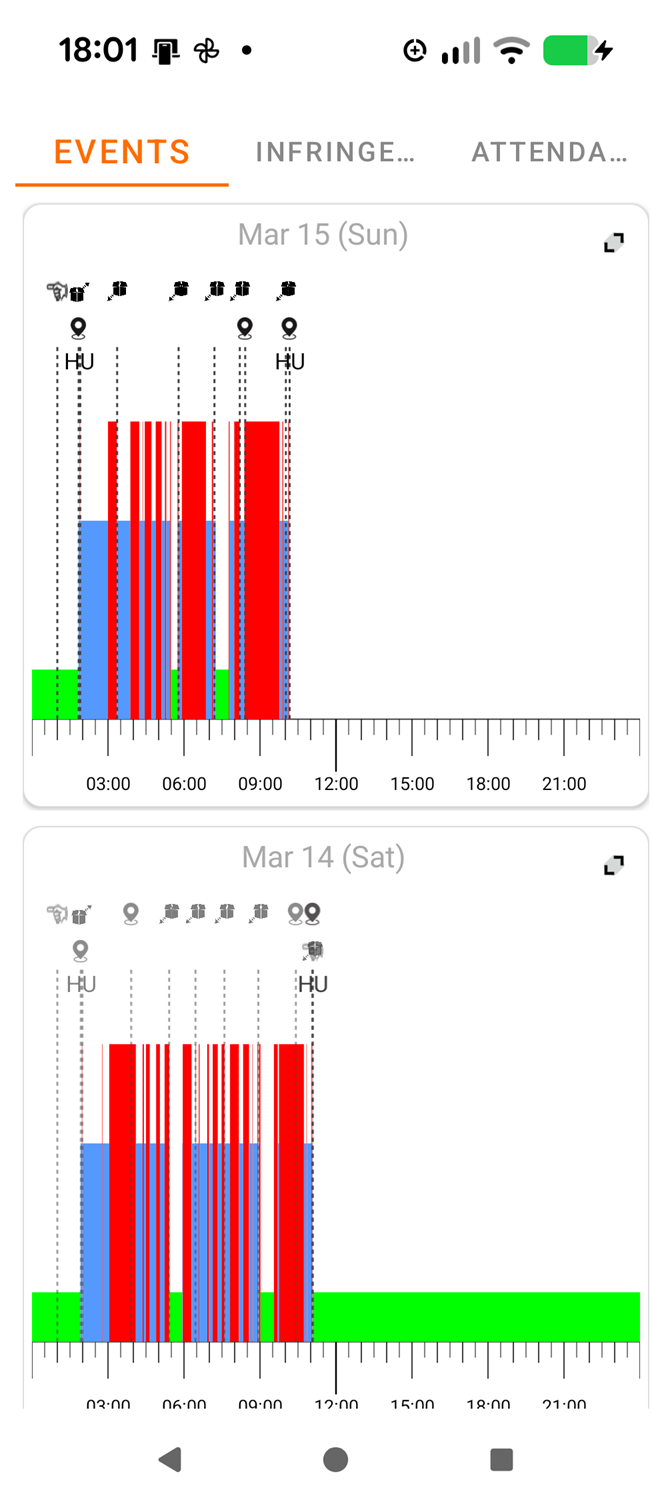
Begivenhedsoversigt
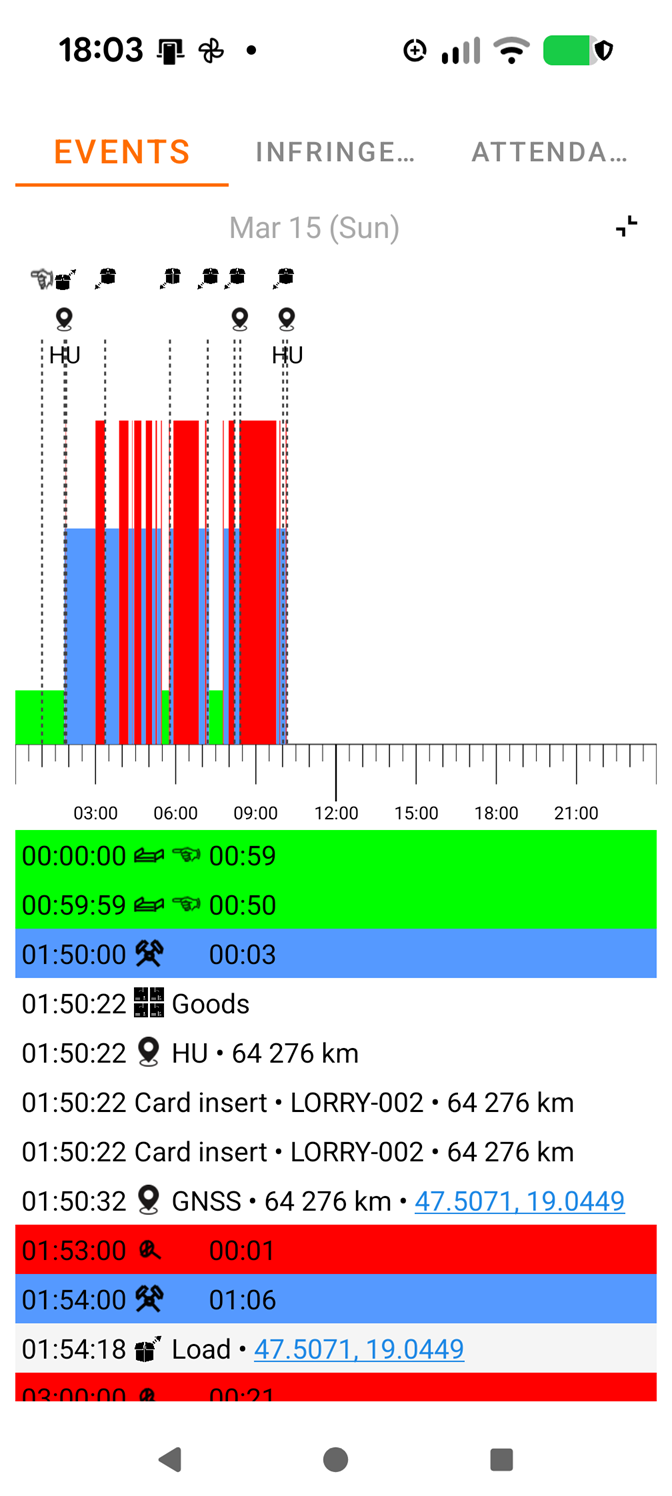
Detaljeret dagvisning
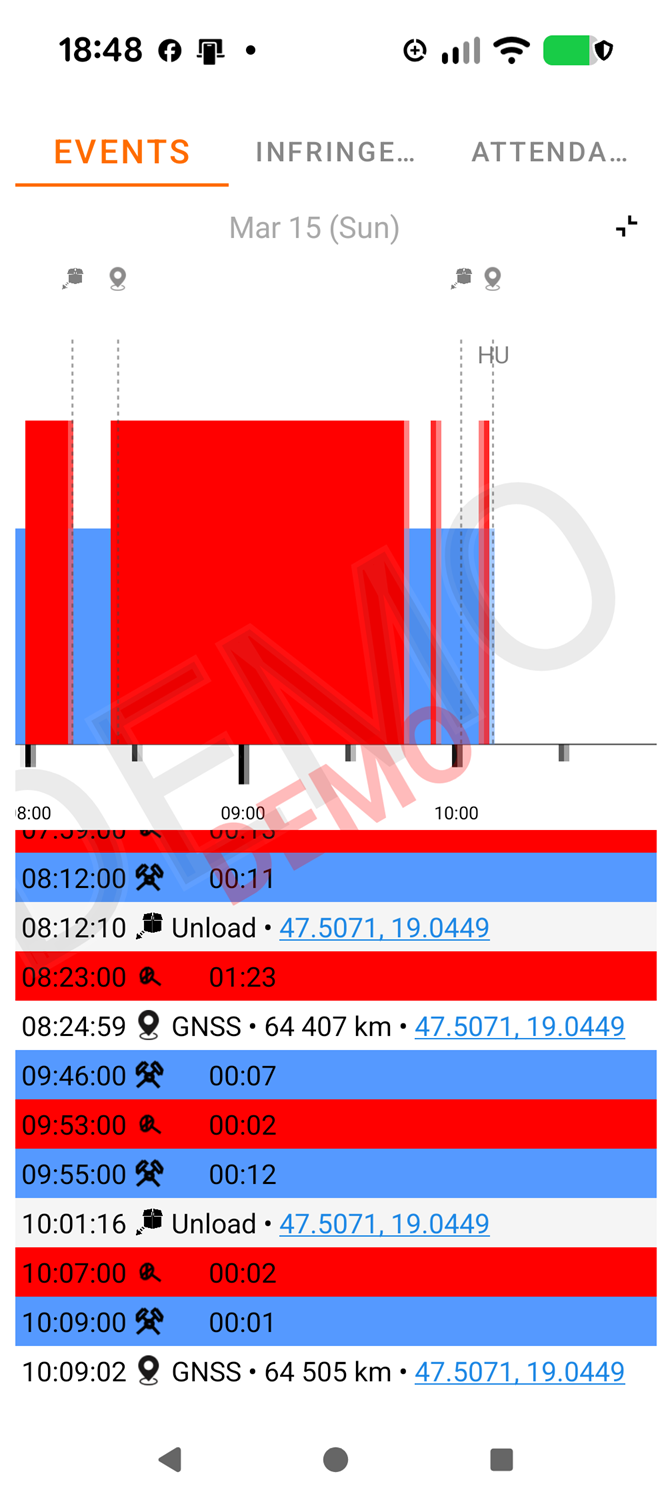
Zoomet visning
Valgt begivenhed
GNSS-position på kort
Tip
Hvis du endnu ikke har downloadet førerkortdata, viser appen demodata med et "DEMO"-vandmærke. Efter kortlæsning vises de rigtige data automatisk.