Events
The Events tab displays a 56-day graphical timeline view showing all driver activities.
Activity color codes
The chart displays the different activities using color coding:
- Driving - the vehicle was in motion
- Work - other work activity (e.g. loading)
- Availability - waiting, on standby
- Rest - rest period
Interactive features
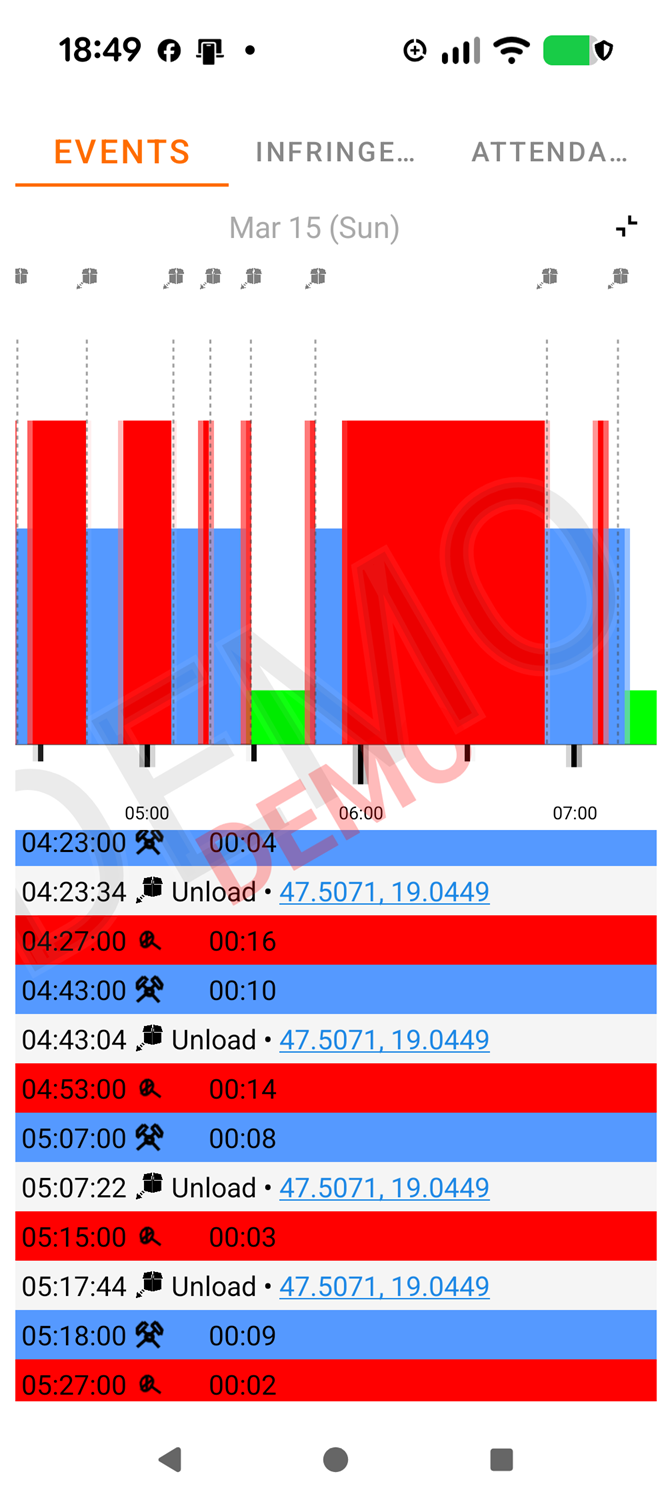
The chart is zoomable: you can pinch to zoom into the details, allowing you to review daily activity down to the minute. Tapping on a day displays the detailed event list for that day with timestamps. Tapping any item in the event list at the bottom automatically zooms the chart to the selected event. Tapping on GNSS coordinates shows the position on the map.
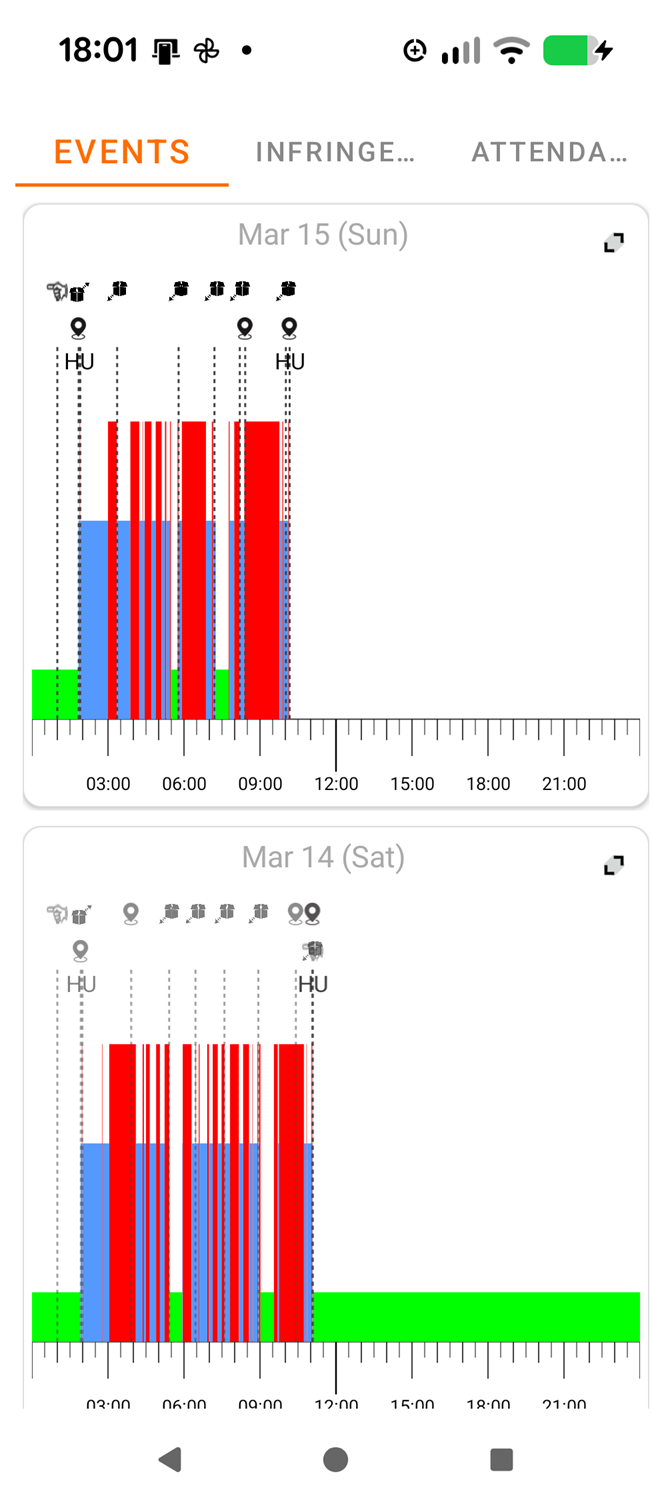
Events overview
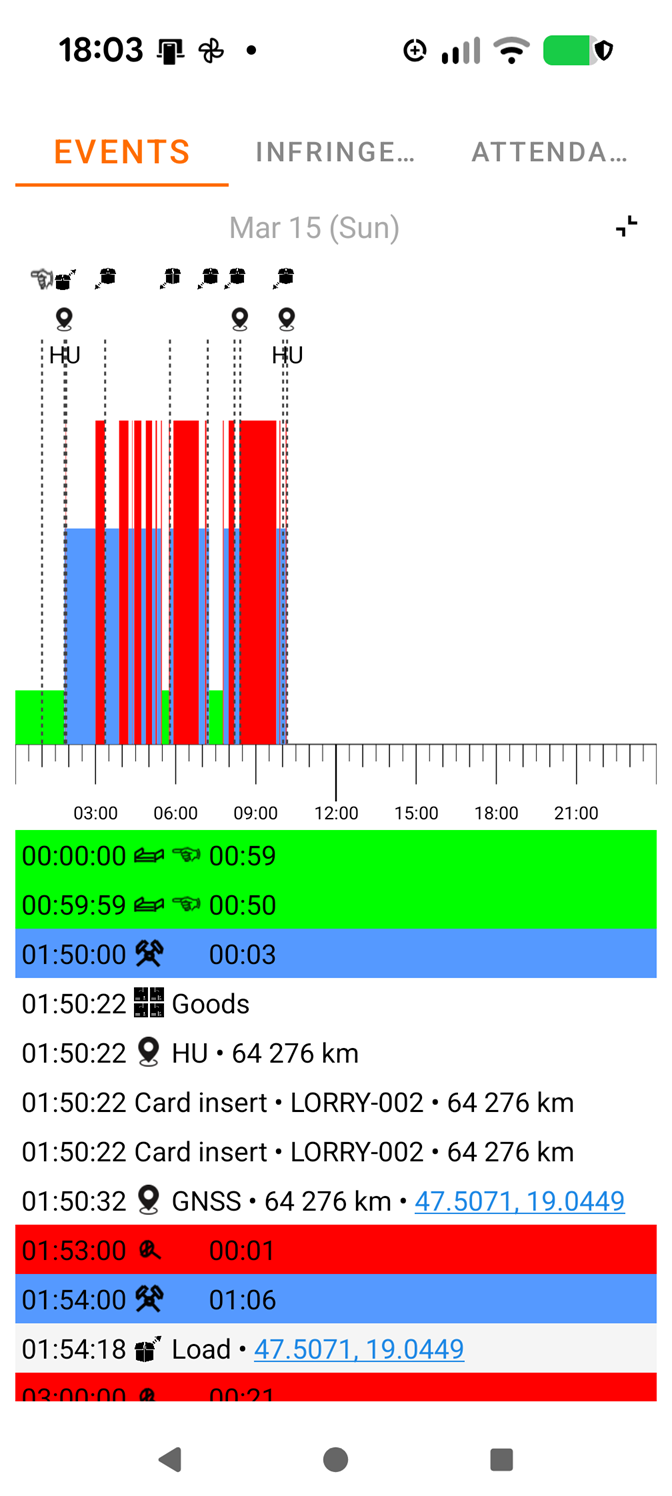
One day detailed view
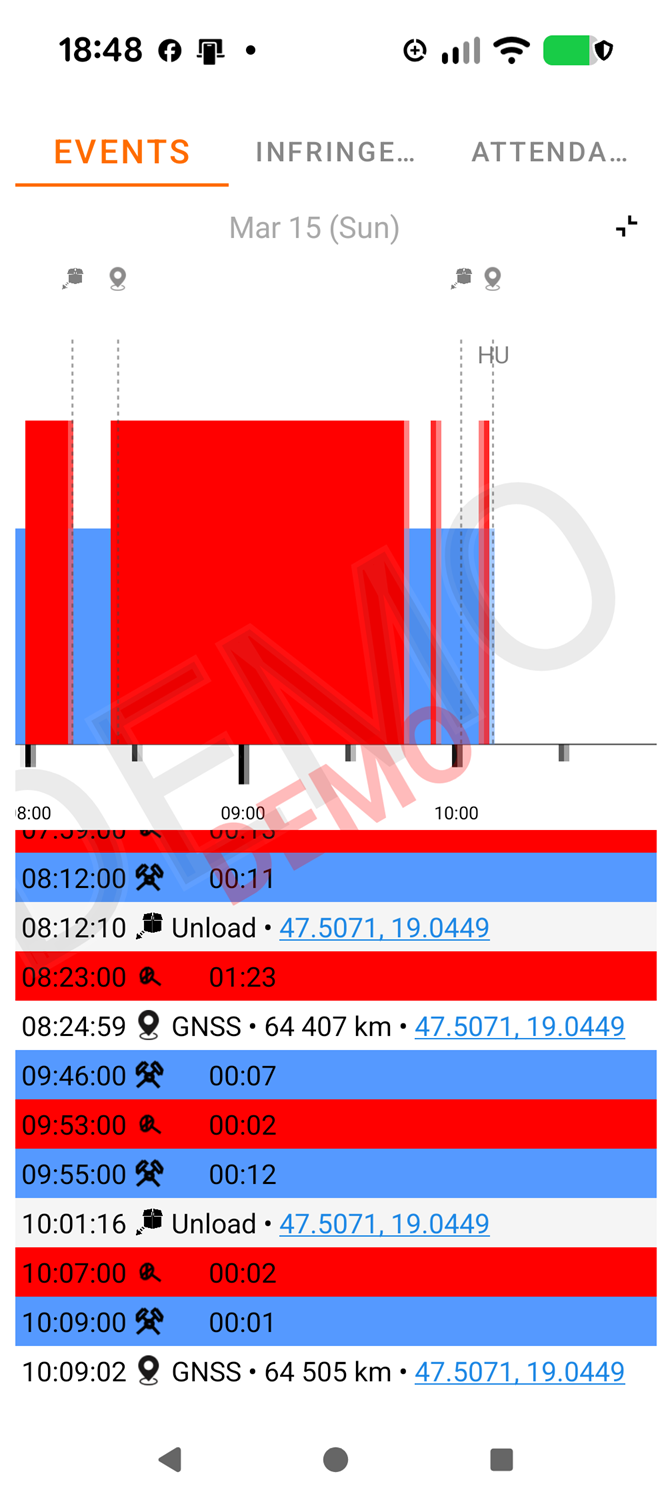
Zoomed view
Tapped on event
GNSS position on map
Tip
If you have not yet downloaded driver card data, the app displays demo data with a "DEMO" watermark. After reading the card, the real data will appear automatically.